
Getting Risk Right When it Matters Most
By Mike McDaniel,
Chief Investment Officer
We pride ourselves in our respect for the markets. We believe that price is truth and that you need to approach investment analysis with humility, or you risk being humbled by the complexity of the markets. If you’re setting client expectations based on antiquated analysis, consider yourself forewarned.
Our Risk Number® and corresponding six-month 95% Historical Range™ is a historical calculation using a variety of statistical inputs, based on each investment’s price history (expense ratios, dividends, etc.). It’s here where advisors use Nitrogen to set robust expectations with clients.
We are very selective about the data series we use when calculating our analysis. Namely, we choose to use data from good, bad, and ugly markets rather than arbitrarily choosing data from trailing 1, 3, 5, and 10 years or relying on outdated asset allocation mapping approaches. Using only the last 10 years’ worth of data conveniently ignores the hellacious 2008-2009 market, when volatility spiked and correlations went to 1.
Proof Positive. The past several years we’ve fielded questions from advisors about the 6-month range and Risk Number we’ve calculated for preferred stocks as we did with respect to other investments and asset classes like Master Limited Partnerships, etc. We understand if you simply used the last 1, 3, 5 or even 10 year price action for preferred stocks, you’d have a very ho-hum attitude with respect to the risks associated with preferred stocks. I mean, the standard deviation for the asset class over the last 10 years was about 6. However, if you chose to include the price action from 2008-2009, like Nitrogen, you’d have a very different expectation. In fact, over the past few years the Risk Number for an ETF tracking a preferred stock index (PFF iShares Preferred and Income Securities ETF) exceeded that of a diversified stock index. As have other preferred stock investments (we only highlight this fund because it is the most widely used preferred stock investment in our system).
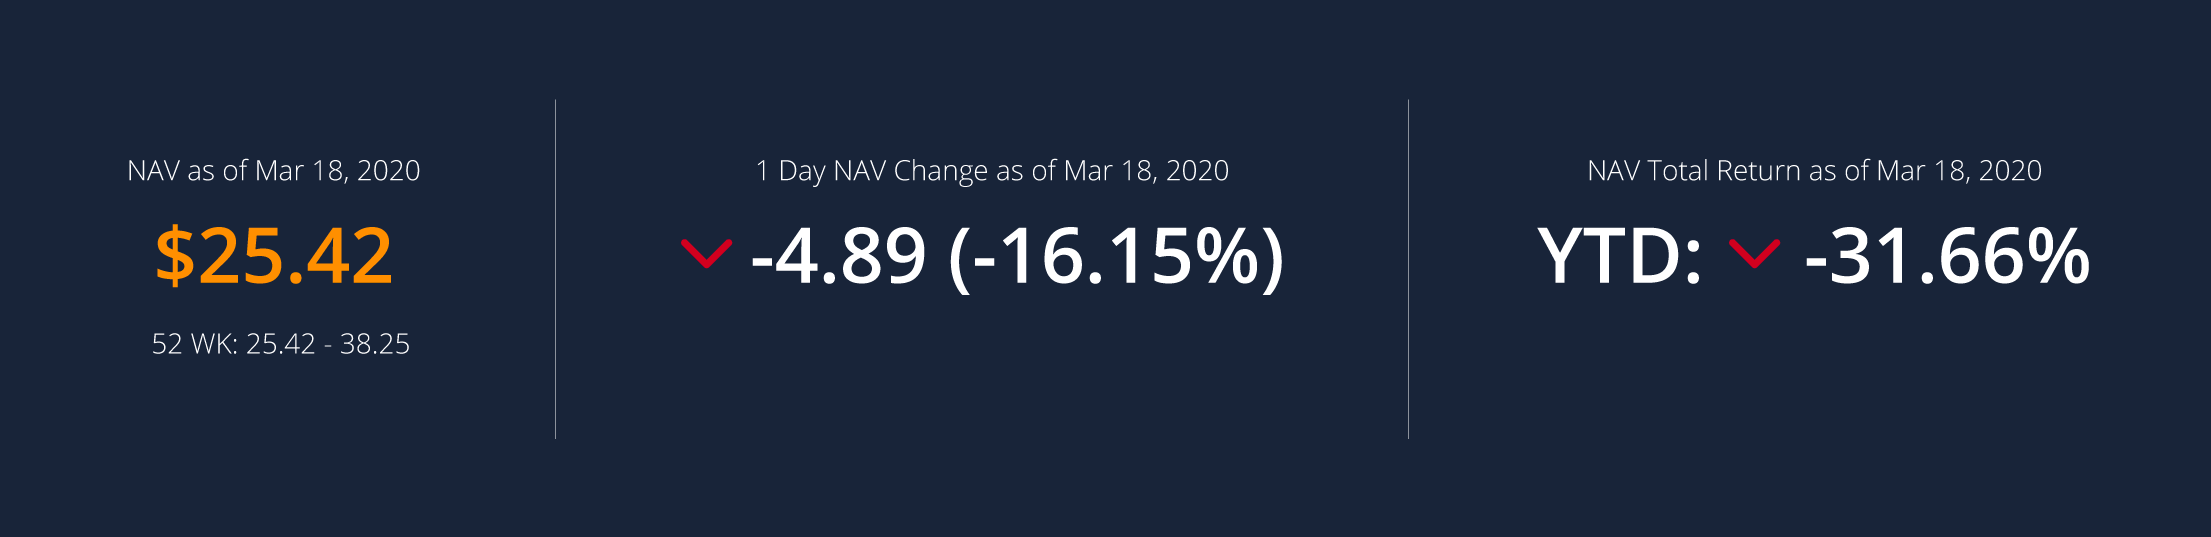
On Wednesday March 18, 2020 that same preferred stock ETF dropped ~16% in a single day. And it’s dropped over 30% year to date.
We implore advisors using fact sheets and antiquated proposal systems to include data from a varied market environment to aid in setting realistic expectations for their clients. If you’d have used an arbitrary 1, 3, 5 or 10 year data look back, you’d have set a very poor expectation and such volatility would have been a complete surprise.